(IBM i fans only) DEBUGGING - How to use the STRSRVJOB and STRDBG commands on IBMi to debug a program in another user's session
How to use the STRSRVJOB and STRDBG commands on IBMi to debug a program in another user's session.
Programming also means, always, debugging. But when a program is installed in a production environment, and an end-user calls to report an issue, sometimes it's useful to connect directly to the user's session in DEBUG mode and step through the program itself.
To do this, the STRSRVJOB command comes to our aid.
First, let me give a brief summary of what a Service Job is and what the debugging activity on IBMi entails.
Service job: In the context of IBMi (formerly known as AS/400 or iSeries) and RPG programming, a service job refers to a separate job that is started to perform specific tasks or services related to a program. These service jobs are often used for debugging, monitoring, or other specialized purposes.
Debugging: One common use of service jobs is for debugging RPG programs. When you want to debug a program interactively, you typically start a service job to run the program. This allows you to set breakpoints, inspect variables, and step through the code line by line while keeping the main job running without interruptions. The service job is responsible for executing the program in a controlled debugging environment.
The "Start Service Job (STRSRVJOB)" command is often used to initiate a service jobs for debugging
Let's see how:


In our case, we often encounter a situation when we need to debug a program (let's call it PGMB), which is launched by another program (let it be PGMA) in a separate BATCH JOB using the SBMJOB command (or, if PGMA is written in C/C++, using the function spawn.
ReplyDeleteIn this case, we launch two instances of the 5250 terminal emulator (A and B). In A we enter
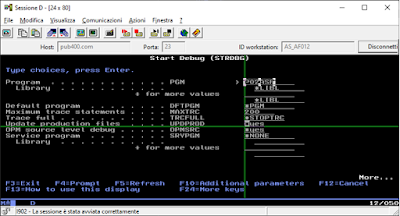
STRDBG PGMA UPDPROD(*YES)
and then somewhere at the input of the program we put a service breakpoint:
sbreak
then press F12 and launch the main program
CALL PGMA
At the moment when PGMB starts and it reaches the established service breakpoint in the terminal A window, we will receive a corresponding notification. There, by pressing F1 we will see the full name of the job in which PGMB is running.
Switch to the terminal B window and type there
STRSRVJOB()
then
STRDBG PGMB UPDPROD(*YES)
and we find ourselves in the place PGMB where we set the service breakpoint. A little further (at least on the next line of code) we set the usual breakpoint (F6), return to window A and press Enter to continue execution.
Switch to window B, press F12. All. We are in debugging mode of a program running in BATCH JOB.
Thank you so much for your useful and insightful comment on our blog article. Your input is greatly appreciated, and it's readers like you who make our content even more valuable. We look forward to hearing more from you in the future! If you have any more thoughts or questions, feel free to share them. Thanks again!
DeleteI remember the days of having to set up specialized testing environments because the tools, strdbg, strsrvjob, strisdb were insufficient to deal with complex debug requirements. But i left those all behind when RDi came along. Just set up a service entry point, and the debugger picks up when the named user starts the named program in the named library. Works for every ILE program. No matter how it is started. No matter how deep it is embedded in a complex call path. Haven't used those old tools for at least a decade.
ReplyDeleteThank you for sharing your experience and insights. It's incredible to see how technology has evolved over the years, making debugging and testing more efficient. I'm glad to hear that RDi has been a game-changer for you, simplifying the debugging process. Your perspective is invaluable, and I appreciate your contribution to the discussion.
Delete